前言

之前的文章介绍了下如何用Prometheus + Grafana来搭积木

文章写于一年前,有一部分内容已经不再适用了,正好随着深入使用遇到的问题和东西越来越多

基于新版本重写一篇。

以下的内容基于环境和组件版本如下

  • CentOS 7

    1
    2
    3
    4
    5
    $ cat /proc/version
    Linux version 3.10.0-862.el7.x86_64 ([email protected]) (gcc version 4.8.5 20150623 (Red Hat 4.8.5-28) (GCC) ) #1 SMP Fri Apr 20 16:44:24 UTC 2018

    $ cat /etc/redhat-release
    CentOS Linux release 7.5.1804 (Core)
  • Node Exporter 0.18.1

  • Prometheus 2.17.1

  • InfluxDB 1.7.10

  • mtail 3.0.0-rc29

我个人惯用配置

  • 下载目录为 ~/installs
  • 软件放在 ~/bin

前置知识

▲ 图片来源:https://prometheus.io/docs/introduction/overview/

给上图各部分做个简单的介绍

  • Prometheus Server: Prometheus服务端,由于存储及收集数据,提供相关api对外查询用。
  • Exporter: 类似传统意义上的被监控端的agent,有区别的是,它不会主动推送监控数据到server端,而是等待server端定时来收集数据,即所谓的主动监控。
  • Pushagateway: 用于网络不可直达而居于exporter与server端的中转站。
  • Alertmanager: 报警组件
  • Web UI: Prometheus的web接口,可用于简单可视化,及语句执行或者服务状态监控。
  • PromQL: 类似于SQL(其实并不是SQL)的查询语言,用于获取计算Prometheus的监控数据
  • Grafana: 替换Prometheus Web UI做数据可视化的工作

准备工作

Node Exporter

Node Exporter处于上面架构图中的 Prometheus Targets: Jobs/Exporters部分

这是一个由Prometheus官方出品的Exporter,可以收集机器上公开的硬件和操作系统指标

包括但不限于 CPU使用情况,内存使用情况,磁盘、网络I/O

下载的话可以在Github Release 界面找到,选择适用于自己机器的包就好。

截至当前,Pre-release版本的已经到了1.0.0-rc.0,鉴于目前来看还是 RC(Release Candidate) ,

而且从发布周期来看,正式版还有一段时间,同时这个版本会引入很多Breaking changes,

这里选用的是当前的 Latest release 版本0.18.1

1
2
3
4
5
6
7
8
9
10
$ cd ~/installs
$ wget https://github.com/prometheus/node_exporter/releases/download/v0.18.1/node_exporter-0.18.1.linux-amd64.tar.gz

$ sha256sum node_exporter-0.18.1.linux-amd64.tar.gz
b2503fd932f85f4e5baf161268854bf5d22001869b84f00fd2d1f57b51b72424 node_exporter-0.18.1.linux-amd64.tar.gz


$ tar -zxvf node_exporter-0.18.1.linux-amd64.tar.gz -C ~/bin
$ cd ~/bin/node_exporter-0.18.1.linux-amd64
$ sudo ln -rs node_exporter /usr/sbin/node_exporter

为了方便设置守护进程和管理,可以用systemd控制

1
2
3
4
5
6
7
8
9
10
11
12
13
14
15
$ cat <<EOF | sudo tee /etc/systemd/system/node_exporter.service
[Unit]
Description=Node Exporter

[Service]
User=root
ExecStart=/usr/sbin/node_exporter

[Install]
WantedBy=multi-user.target
EOF

$ sudo systemctl daemon-reload
$ sudo systemctl start node_exporter
$ sudo systemctl enable node_exporter

启动后,可以在本机的9100端口查看数据

1
2
3
4
5
6
7
8
$ curl localhost:9100
<html>
<head><title>Node Exporter</title></head>
<body>
<h1>Node Exporter</h1>
<p><a href="/metrics">Metrics</a></p>
</body>
</html>

Prometheus

Prometheus是Cloud Native Computing Foundation项目,是一个系统和服务监视系统。

它以给定的时间间隔从已配置的目标收集指标,显示结果,实现告警。

Prometheus适用于

  • 用来做机器状态或者服务状态的监控

  • 单机部署时不依赖其他网络存储和服务,用来快速排查问题

Prometheus不适用于

  • 需要收集完整准确的计费数据,因为它本身就是固定时间间隔进行采样

下载地址也是在Github Releases上,根据自己的情况选择对应版本。

1
2
3
4
5
6
7
8
9
$ cd ~/installs
$ wget https://github.com/prometheus/prometheus/releases/download/v2.17.1/prometheus-2.17.1.linux-amd64.tar.gz
$ sha256sum prometheus-2.17.1.linux-amd64.tar.gz
a3b0f1638e442c4b3d057404a93154f20df5a6073cef472a09b19a17b0c4ebfe prometheus-2.17.1.linux-amd64.tar.gz

$ tar -zxvf prometheus-2.17.1.linux-amd64.tar.gz -C ~/bin
$ cd ~/bin/prometheus-2.17.1.linux-amd64/
$ sudo ln -rs prometheus /usr/sbin/prometheus
$ sudo ln -rs prometheus.yml /etc/sysconfig/prometheus

同样的,我们用systemd来控制

1
2
3
4
5
6
7
8
9
10
11
12
13
14
15
16
17
18
19
$ cat <<EOF | sudo tee /etc/systemd/system/prometheus.service
[Unit]
Description=Prometheus Server
Documentation=https://prometheus.io/docs/introduction/overview/
After=network-online.target

[Service]
User=root
Restart=on-failure
ExecStart=/usr/sbin/prometheus \
--config.file=/etc/sysconfig/prometheus

[Install]
WantedBy=multi-user.target
EOF

$ sudo systemctl daemon-reload
$ sudo systemctl start prometheus
$ sudo systemctl enable prometheus

启动后,可以在本机的9090端口查看数据

这时候没有把Node exporter 添加到收集的监控数据中,需要修改配置文件,添加上这部分配置

1
2
3
4
5
6
7
8
9
10
11
12
13
14
15
16
17
18
19
20
21
22
23
24
25
26
27
28
29
30
31
32
33
34
# my global config
global:
scrape_interval: 15s # Set the scrape interval to every 15 seconds. Default is every 1 minute.
evaluation_interval: 15s # Evaluate rules every 15 seconds. The default is every 1 minute.
# scrape_timeout is set to the global default (10s).

# Alertmanager configuration
alerting:
alertmanagers:
- static_configs:
- targets:
# - alertmanager:9093

# Load rules once and periodically evaluate them according to the global 'evaluation_interval'.
rule_files:
# - "first_rules.yml"
# - "second_rules.yml"

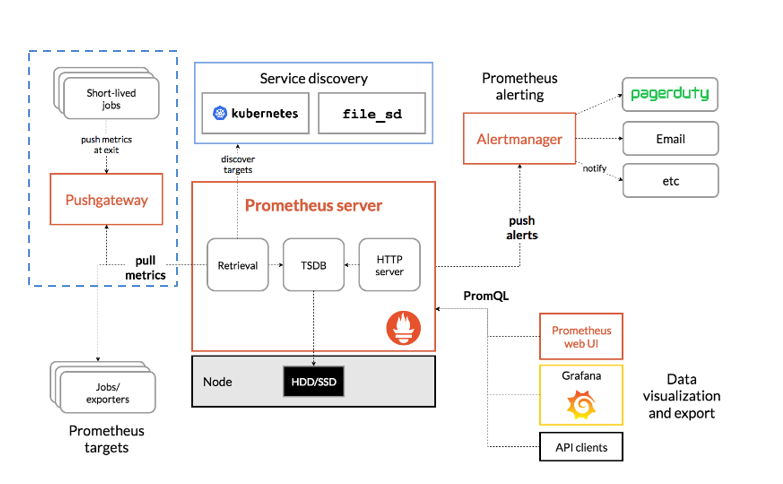
# A scrape configuration containing exactly one endpoint to scrape:
# Here it's Prometheus itself.
scrape_configs:
# The job name is added as a label `job=<job_name>` to any timeseries scraped from this config.
- job_name: 'prometheus'

# metrics_path defaults to '/metrics'
# scheme defaults to 'http'.

static_configs:
- targets: ['localhost:9090']
- job_name: 'node-exporter'
static_configs:
- targets: ['localhost:9100']
labels:
env: 'local'

写完后可以用自带的工具预先检测一遍

1
2
3
$ ./promtool check config prometheus.yml 
Checking prometheus.yml
SUCCESS: 0 rule files found

配置修改后需要重启服务加载新配置

1
$ sudo systemctl restart prometheus

![](https://counter2015.com/picture/grafana2-2 .jpg)

Grafana

Grafana是一个监控用的仪表盘工具,主要处理监控数据的可视化,附带着能做一些简单的告警功能。

官方提供的Live Demo

下载可以参考官方说明

1
2
3
4
5
6
7
$ wget https://dl.grafana.com/oss/release/grafana-6.7.2-1.x86_64.rpm
$ sha256sum grafana-6.7.2-1.x86_64.rpm
e41b296cf716af99d0aa2d527f035b8c1fe1dd176b4feb45789c01fd4312bf86 grafana-6.7.2-1.x86_64.rpm
$ sudo yum install grafana-6.7.2-1.x86_64.rpm
$ sudo systemctl daemon-reload
$ sudo systemctl enable grafana-server.service
$ sudo systemctl start grafana-server.service

服务启动后,在本机的3000端口可以通过浏览器进行登录

默认的用户名和密码都是admin

第一次登录后会要求重设密码

进入后需要配置数据来源,也就是之前的启动的Prometheus

这里我就直接拿以前的图来用了,基本没有什么变化

感谢这个模板,这里我根据个人的需要修改了下,效果如下

与InfluxDB集成

默认的情况下,Prometheus的数据存放时间是15天,也就是说,这样无法和之前的数据来对比

这时候需要引入额外的数据库来存放历史数据

Prometheus的文档里列举了需要可选的组件,这里选用的是InfluxDB,可以根据自身情况调研选用其他数据库

1
2
3
4
5
6
7
8
9
10
11
12
13
$ cat <<EOF | sudo tee /etc/yum.repos.d/influxdb.repo
[influxdb]
name = InfluxDB Repository - RHEL \$releasever
baseurl = https://repos.influxdata.com/rhel/\$releasever/\$basearch/stable
enabled = 1
gpgcheck = 1
gpgkey = https://repos.influxdata.com/influxdb.key
EOF

$ sudo yum install influxdb
$ sudo systemctl daemon-reload
$ sudo systemctl enable influxdb
$ sudo systemctl start influxdb

备份和转储的步骤可以参考官方文档:

https://docs.influxdata.com/influxdb/v1.8/administration/backup_and_restore/

这里假设的是新配置监控,如果需要导入历史数据可以在创建数据表前做如下操作

  1. 在存放历史数据的机器(假设ip地址为10.1.2.3)修改配置文件,重启服务使配置生效
1
2
3
4
5
$ sudo vim /etc/influxdb/influxdb.conf
# Bind address to use for the RPC service for backup and restore.
bind-address = "10.1.2.3:8088"

$ sudo systemctl restart influxdb
  1. 在新的机器上执行如下命令从远程备份数据

    1
    $ influxd backup -portable -database prometheus -host 10.1.2.3:8088 /tmp/influxdb-backup

    耗费的时间和数据大小以及网络情况有关,我个人测试的速度大约是1GB/分钟,注意备份的数据兼容问题,只对小版本号或差异较小时有效,比如1.7.3的可以备份到1.8.0

  2. 导入数据

    1
    $ influxd restore -portable -database prometheus /tmp/influxdb-backup

如果已经存在对应数据库prometheus的情况下,就需要通过侧载(sideload)来还原数据

1
2
3
4
$ influxd restore -portable -db prometheus -newdb prometheus_bak /tmp/influxdb-backup2
$ influx
> use prometheus_bak
> SELECT * INTO prometheus..:MEASUREMENT FROM /.*/ WHERE time>'2020-04-07T06:01:00Z' and time <'2020-04-13T07:59:00Z' GROUP BY *

假如是全新的配置,不需要导入历史数据的情况下的话,需要创建对应数据库

1
2
3
4
5
6
7
8
9
10
$ influx -precision rfc3339
Connected to http://localhost:8086 version 1.7.10
InfluxDB shell version: 1.7.10
> CREATE DATABASE "prometheus"
> SHOW DATABASES
name: databases
name
----
_internal
prometheus

修改prometheus.yml配置文件,添加如下配置

1
2
3
4
5
6
7
$ vim prometheus.yml
# Set remote read/write use local influxdb database
remote_write:
- url: "http://localhost:8086/api/v1/prom/write?db=prometheus"

remote_read:
- url: "http://localhost:8086/api/v1/prom/read?db=prometheus"

配置完成后,验证并重启

1
2
3
4
$ ./promtool check config prometheus.yml
Checking prometheus.yml
SUCCESS: 0 rule files found
$ sudo systemctl restart prometheus

此时已经能在influxDB里查看数据

1
2
3
4
5
6
7
8
9
10
11
12
13
14
15
16
17
18
19
20
21
22
23
24
$ influx -precision rfc3339
> show measurements limit 3
name: measurements
name
----
go_gc_duration_seconds
go_gc_duration_seconds_count
go_gc_duration_seconds_sum

> select * from node_load1 limit 5
name: node_load1
time __name__ env instance job value
---- -------- --- -------- --- -----
2020-04-12T10:18:28.052Z node_load1 local localhost:9100 node-exporter 0
2020-04-12T10:18:43.052Z node_load1 local localhost:9100 node-exporter 0
2020-04-12T10:18:58.053Z node_load1 local localhost:9100 node-exporter 0
2020-04-12T10:19:13.053Z node_load1 local localhost:9100 node-exporter 0.27
2020-04-12T10:19:28.053Z node_load1 local localhost:9100 node-exporter 0.21

> select * from _internal.."database" where "database"=~/prometheus/ order by time desc limit 1
name: database
time database hostname numMeasurements numSeries
---- -------- -------- --------------- ---------
2020-04-12T11:01:20Z prometheus mycentos 413 917

详细的SQL命令可以参考官方文档

由于数据的存储也是需要占用空间的,所以我们需要按照实际存储的指标数量来简单估算下

Database names, measurements, tag keys, field keys, and tag values are stored only once and always as strings. Only field values and timestamps are stored per-point.
Non-string values require approximately three bytes. String values require variable space as determined by string compression

这里就根据磁盘大小设置了数据的过期策略

1
2
3
4
5
6
> CREATE RETENTION POLICY "800_day_only" ON "prometheus" DURATION 800d REPLICATION 1
> SHOW RETENTION POLICIES
name duration shardGroupDuration replicaN default
---- -------- ------------------ -------- -------
autogen 0s 168h0m0s 1 true
800_day_only 19200h0m0s 168h0m0s 1 false

基于日志的监控

假如说我们现在已经有了一套线上正在运行的系统,不方便做侵入式的修改,一个选择是对日志进行分析来实现监控

日志中分为很多行,我们可以提取出响应外部请求的行来统计TPS( Transactions Per Second , 每秒处理事务数)

同样的方法可以获取请求的耗时

步骤大致如下:

  • 解析日志中需要的字段
  • 计算出需要的监控指标
  • 将指标以Prometheus需要的形式通过Http接口暴露出来

其实这里还有一个部分比较麻烦,那就是日志的轮转

轮转策略

一般来说,现在的硬盘也比以前便宜了,日志可以通过各种收集工具传到远程存储以备后续查看

但是服务器上能保存的日志大小还是有限的,同时为了方便查看,会按大小/时间等因素 来对日志切分

我们监控需要对最新的文件做监控,这里就需要对文件的变化做出反应

假设最新的日志是server.log,切日志有这么几种情况

  • 日志达到一定大小后,把旧的日志mv走,新的日志继续用原来的名字server.log,更换文件句柄写入
  • 每天切分日志,凌晨时把前一天的日志换走压缩,新的日志用原来的名字
  • 使用软链接,日志达到切分条件后,更改软链接

这里推荐使用Google开发的mtail

能轻松解决上述场景中的大部分问题

本质上通过写DSL来方便地实现Exporters

mtail is a tool for extracting metrics from application logs to be exported into a timeseries database or timeseries calculator for alerting and dashboarding.

一个简单的例子

1
2
3
4
5
6
7
8
9
10
11
12
13
14
15
16
17
18
19
20
counter loglines
gauge response_time
histogram time_hist buckets 10, 30, 50, 100, 200

def parseLog {
/^I(?P<date>\d{4} \d{2}:\d{2}:\d{2})/ {
strptime($date, "0102 15:04:05")
next
}
}

@parseLog {
/I[0-9]{4}/ {
loglines ++
/.+[0-9]+(\.[0-9]+){3}\s+\d+\s+\d+\s+\d+\s+\d+\s+([0-9]+).+/ {
response_time = $2
}
time_hist = response_time
}
}

这个也不支持复杂的语法,一般就是正则提取,简单计算下就行了

这个情况可以满足大多数情况,但是有一个例外,就是日志用软链接指向的时候,看起来当前版本(3.0.0-rc29)还是不能很好的处理这个问题

这里我做了一个work around,用crontab调用stat获取日志软链的摘要,对其求md5并定时校验

一旦软链接发生修改md5变化,重启mtail以获取最新的文件句柄

这个做法很简便,但是有个问题是,切换日志的过程中无法获取监控指标,会有1分钟(受crontab限制)的延迟

如果用告警的话看起来就像服务假死了一样,其实不然,只是因为此时mtail还在读取旧的日志文件,但是旧的日志文件已经不再有新的数据了,需要重启才能获取正确的文件句柄

自定义Exporter

有时候需要的监控指标官方的Exporters没有实现,这时候就需要自己动手了。

在官方的Client Libraries里支持

  • Go
  • Java or Scala
  • Python
  • Ruby

选择一门自己喜欢的语言就能实现了,一般就是导个prometheus的包,然后根据自己的需要做数据处理就行了

这里就不再赘述

告警

prometheus有一个alert manager的组件,目前还在测试版本好,用起来也比较复杂

这里介绍的是grafana自带的邮件报警

需要先在配置文件中启用

1
2
3
4
$ sudo vim /etc/grafana/grafana.ini
[smtp]
enabled = true
host = localhost:25

重启使配置生效

1
$ sudo systemctl restart grafana-server

以下的步骤测试了下和旧版本基本相同,就偷懒把图片照搬过啊里了

首先添加一个新的邮件报警频道

然后设置该频道内接收邮件的邮箱地址

配置好后,我们可以测试下

接下来可以对某个具体的表格,设置邮件报警的规则和检查频率

收到的邮件大概长这个样子

通过Grafana内置的报警,能够简单方便地设置告警规则,但是缺点也是它过于简单,无法配置复杂的告警规则。

https://prometheus.io/docs/alerting/alertmanager/)

其他问题

一张图中的数据过多

这种情况下可以考虑给Dashboard添加Variables,参见文档

配置文件太长

1
2
$ wc -l prometheus.yml
927 prometheus.yml

这时候手打已经吃不消了,可以考虑用脚本或者框架

我个人是自己实现了一个简单的配置生成脚本

1
2
3
4
5
6
7
8
9
10
11
12
13
14
15
16
17
18
19
20
21
22
23
24
25
26
27
28
29
30
31
32
33
34
35
36
37
38
39
40
41
42
43
44
45
46
47
48
49
50
51
52
53
54
55
56
57
58
59
60
61
62
63
64
65
66
67
68
69
70
71
72
73
74
75
76
77
78
79
80
81
82
83
84
85
86
87
88
89
90
91
92
93
94
95
96
97
98
99
100
101
102
103
104
105
106
107
108
109
110
111
112
113
114
115
116
117
118
119
120
121
122
123
124
125
126
127
128
#!/bin/sh
exec scala -feature -deprecation "$0" "$@"
!#

/*
example:
chmod +x ConfigGenerator.scala
echo -e "10.2.4.2\n10.1.2.3" > ip.txt
./ConfigGenerator.scala -j log-monitor -p 3903 -L env=test -L group=cluster1 -f ip.txt

it will output
- job_name: 'log-monitor'
static_configs:

- targets: ['10.2.4.2:3903']
labels:
group: "cluster1"
env: "test"
instance: "10.2.4.2"

- targets: ['10.1.2.3:3903']
labels:
group: "cluster1"
env: "test"
instance: "10.1.2.3"
*/
object ConfigGenerator {
import scala.language.implicitConversions
implicit def strToSymbol(str: String): Symbol = Symbol(str)

def usage(): Unit = {
val usageMessage: String =
"""
| ./ConfigGenerator.scala -j <job_name> -p <port> -f <ip_list_file> [-L <label_name>=<label_string> ...]
|
| -j <job_name>
| it will be generate to
| " - job_name: 'machine_state'"
|
| -p <port>
| target port for prometheus metrics
|
| -f <ip_list_file>
| the file of all instance ip, one ip for one line
|
| -L <label_name>=<label_string>
| this may contain multiple configuration item, such as
| "-L env=test -L enable=on"
| it will be generate to
| env: "test"
| enable: "on"
| it should contain the same <label_name> twice
|""".stripMargin
println(usageMessage)
sys.exit(1)
}

def main(args: Array[String]): Unit = {
if (args.length == 0) usage()
val argList = args.toList
type OptionMap = Map[Symbol, Any]

@scala.annotation.tailrec
def nextOption(map : OptionMap, list: List[String]) : OptionMap = {
list match {
case Nil => map
case "-j" :: value :: tail =>
nextOption(map ++ Map(Symbol("job") -> value.toString), tail)
case "-p" :: value :: tail =>
nextOption(map ++ Map(Symbol("port") -> value.toString), tail)
case "-f" :: value :: tail =>
nextOption(map ++ Map(Symbol("file") -> value.toString), tail)
case "-L" :: value :: tail =>
if (value.split("=").length != 2) {
println(s"'$value' is not a valid format")
usage()
}
val labelName = value.split("=").head
val labelText = value.split("=").last
nextOption(map ++ Map(Symbol(labelName) -> labelText), tail)
case option :: tail =>
println("Unknown option "+ option)
sys.exit(1)
}
}

val defaultSymbols = Array(Symbol("job"), Symbol("port"), Symbol("file"))
def template(ipList: Array[String], optionMap: OptionMap): String = {
val job = optionMap("job")
val port = optionMap("port")
val header =
s"""
| - job_name: '$job'
| static_configs:
|""".stripMargin


val labelKeyValues = optionMap.view.filterKeys(!defaultSymbols.contains(_))
val labelsConfigs = labelKeyValues.map(x => {
val labelText = x._1.name
val labelValue = x._2.toString
s""" $labelText: "$labelValue"""".stripMargin
}).mkString("\n")


def body(ip: String) =
s"""
| - targets: ['$ip:$port']
| labels:
|""".stripMargin +
labelsConfigs + s"""\n instance: "$ip""""


val res = header + ipList.map(body).mkString("\n") + "\n"
println(res)
res
}

val options = nextOption(Map(), argList)
if (defaultSymbols.exists(!options.contains(_))) {
println(s"need to set default config: ${defaultSymbols.map(_.name).mkString(",")}")
usage()
}

val ipFileHandle = scala.io.Source.fromFile(options("file").toString)
template(ipFileHandle.getLines().toArray, options)
}
}

WHAT’S MORE

Ansible playbook 批量部署 node-exporters 服务

参考资料

  1. Prometheus + Grafana 监控配置指北:打造日志监控系统

  2. 使用 InfluxDB作为Prometheus远程存储

  3. 使用Scala开发应用程序 Prometheus Exporter

  4. Granafa 下载

  5. stackexchange: Too many levels of symbolic links

  6. man: systemd.service

  7. Understanding and administering systemd

  8. How to Install Prometheus Monitoring and node_exporter on CentOS 8